E-commerce interactive financial report
Problem statement
This project adresses a problem of an E-commerce company based in India. This company has a dataset of the orders placed between 2018/04 — 2019/03 and the target revenue per month. With this information, it is desired to:
- Detect which product categories generate more revenue and have higher profit
- Compare financial performance by geographic locations
- Identify geographic locations that contribute higher revenue
- Visualize the company's financial performance over time
With a tool that is easy to use by non-technical people. Said tool should also be able to display detailed information if desired.
The dataset
The dataset provided by the company consists of 3 CSV files, each one with only one table. These files are: List of Orders.csv, Order Details.csv and Sales target.csv. The features of each table are:
List of Orders.csv
Table with essential order information. It should only contain one row for each order placed.
- Order ID: Unique identifier for each order placed
- Order Date: Date when the order was placed
- CustomerName: Name of the customer who placed the order
- State: State where the order will be sent
- City: City where the order will be sent
Order Details.csv.csv
Table with information on the products included in each order. There can be more than one row per order given that each order can contain products from a different category and sub-category.
- Order ID: Unique identifier for each order placed
- Amount: Revenue generated by order items
- Profit: Profit or loss generated by the items in the order
- Quantity: Number of items in the order
- Category: Category of products. For example, electronic
- Sub-Category: Sub-category of products. For example, printers
Sales target.csv
Table with information on the company's financial objectives by month and category.
- Month of Order Date: Month and year
- Category: Category of products. For example, electronic
- Target: Target revenue
The key to the problem
- The tool must be easy-to-use for non-technical people
- The key insights must be easily seen at first glance
- The tool should allow easy access to the information details
- Detect the categories/sub-categories that generate more revenue and optimize profit or loss
- Compare financial performance by geographic location
- Identify geographic locations that provide the highest average revenue
- Visualize the company's financial performance over time
- Most relevant variables:
- Order ID: connect the tables
List of OrdersandOrder Detalis; count number of unique orders - Order Date: transform this feature to connect
Order DetailswithSales targettable - Month of Order Date: transform this feature to connect
Order DetailswithSales targettable - State: group information by geographic location
- City: group information by geographic location
- Amount: revenue
- Profit: profit / loss
- Category: group information by category
- Sub-category: group information by sub-category
- Target: target revenue
- Order ID: connect the tables
Proposed Solution
It is proposed to create an Excel file / report with 3 sheets as you can see in this example proposal:
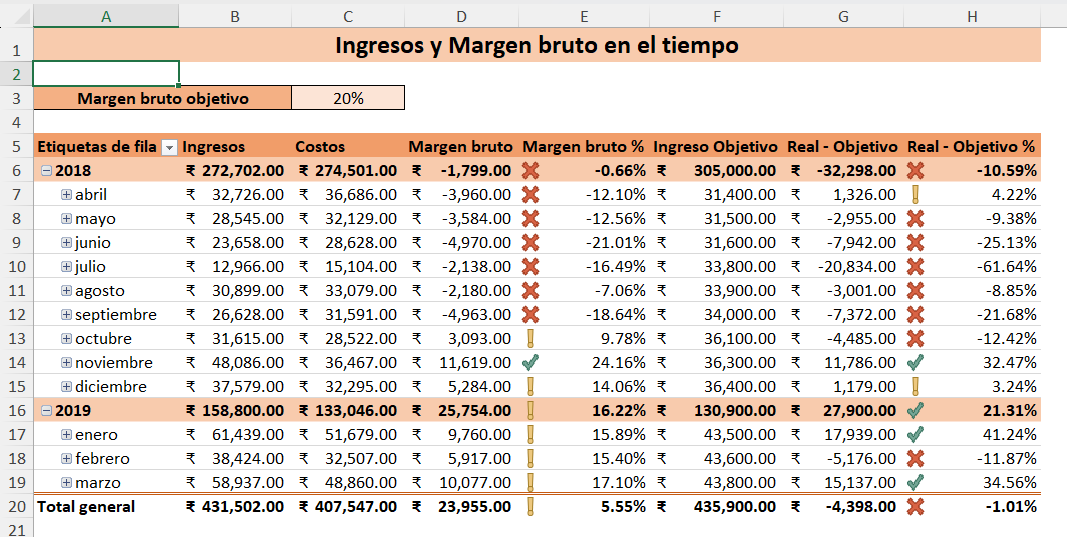
- Revenue, Gross Profit Margin and comparison with Target Revenue over time
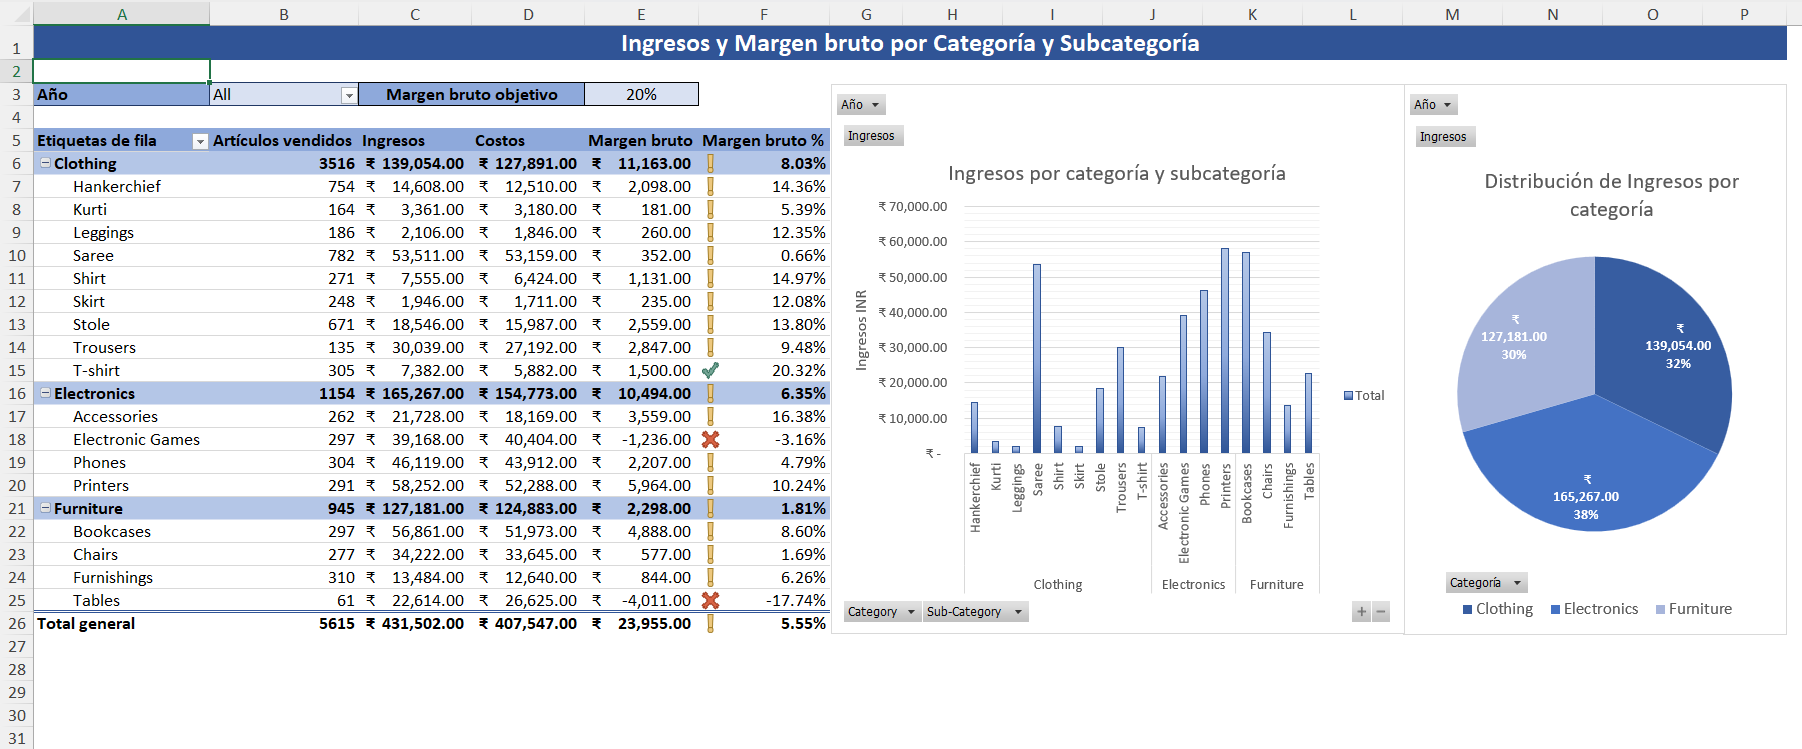
- Revenue and Gross Profit Margin by Product Category and Sub-Category
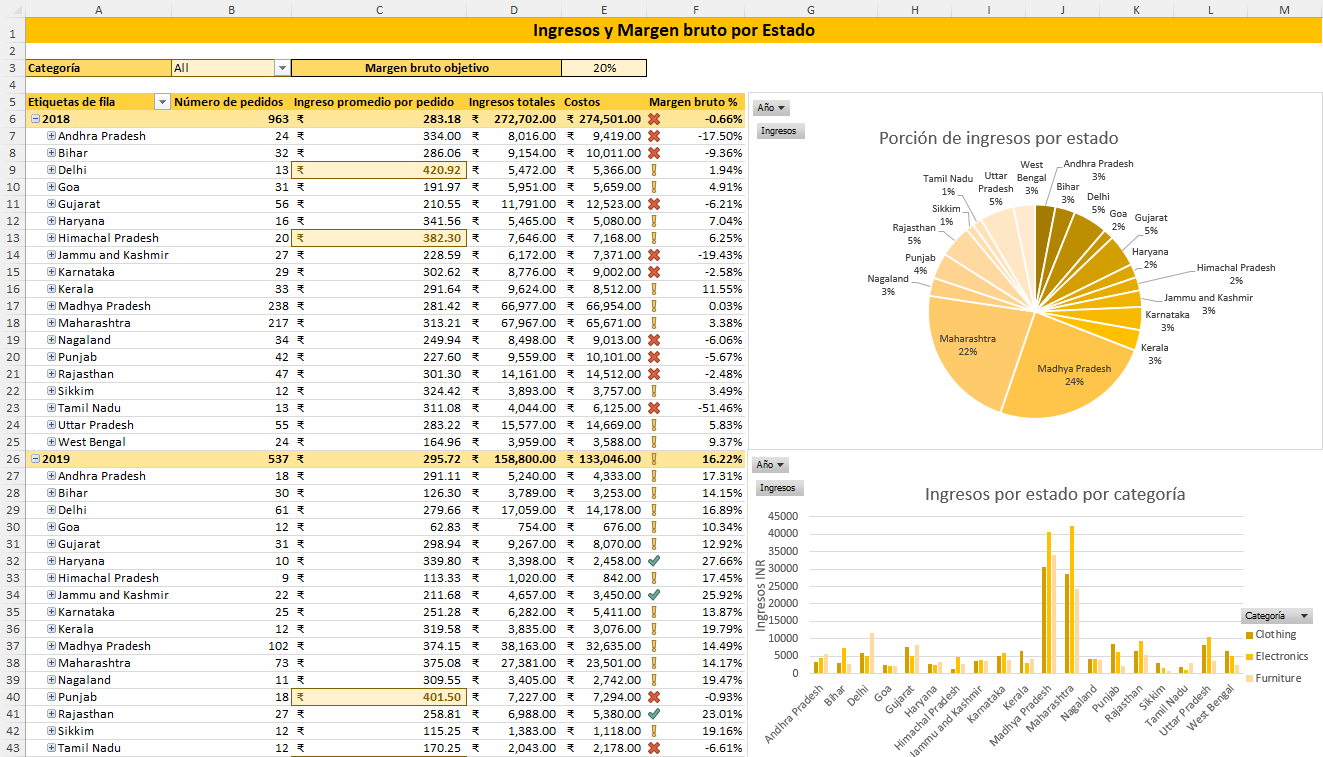
- Revenue, Gross Profit Margin and Average Revenue by State
This proposal can be easily used by non-technical people because Excel is widely used in the industry and the user interface is fairly standard (pivot tables and charts). Additionally, this proposal addresses the key points:
- The conditional formatting with identifiable icons (❌❕✅) within the pivot tables makes it easy to see how well the company's target performance was achieved both in gross margin and target revenue.
- Bar and pie charts summarize the key insights about the categories/sub-categories and geographic locations with the highest revenue contribution
- The charts also display the comparison between geographic locations and categories/sub-categories
- Pivot tables have filters and/or drop-down fields to provide an easy, visual way to view the information details without visual clutter
Example proposal


Solution implementation in Excel
Extract, Transform and Load data with Power Query and Power Pivot
First, the three files List of Orders.csv, Order Details.csv and Sales target.csv were connected with Power Query as CSV files (a connection to this GitHub repository was subsequently used). Afterwards, the following pipelines were applied to each of the tables.
Order Details Pipeline
- Source: extract data from this GitHub repository
- Promoted Headers: use the first row of the CSV file as headers
- Changed Type: automatically detect the data types for each column
- Remove blank rows
- Rename Amount column as Revenue
--- Data cleaning ---
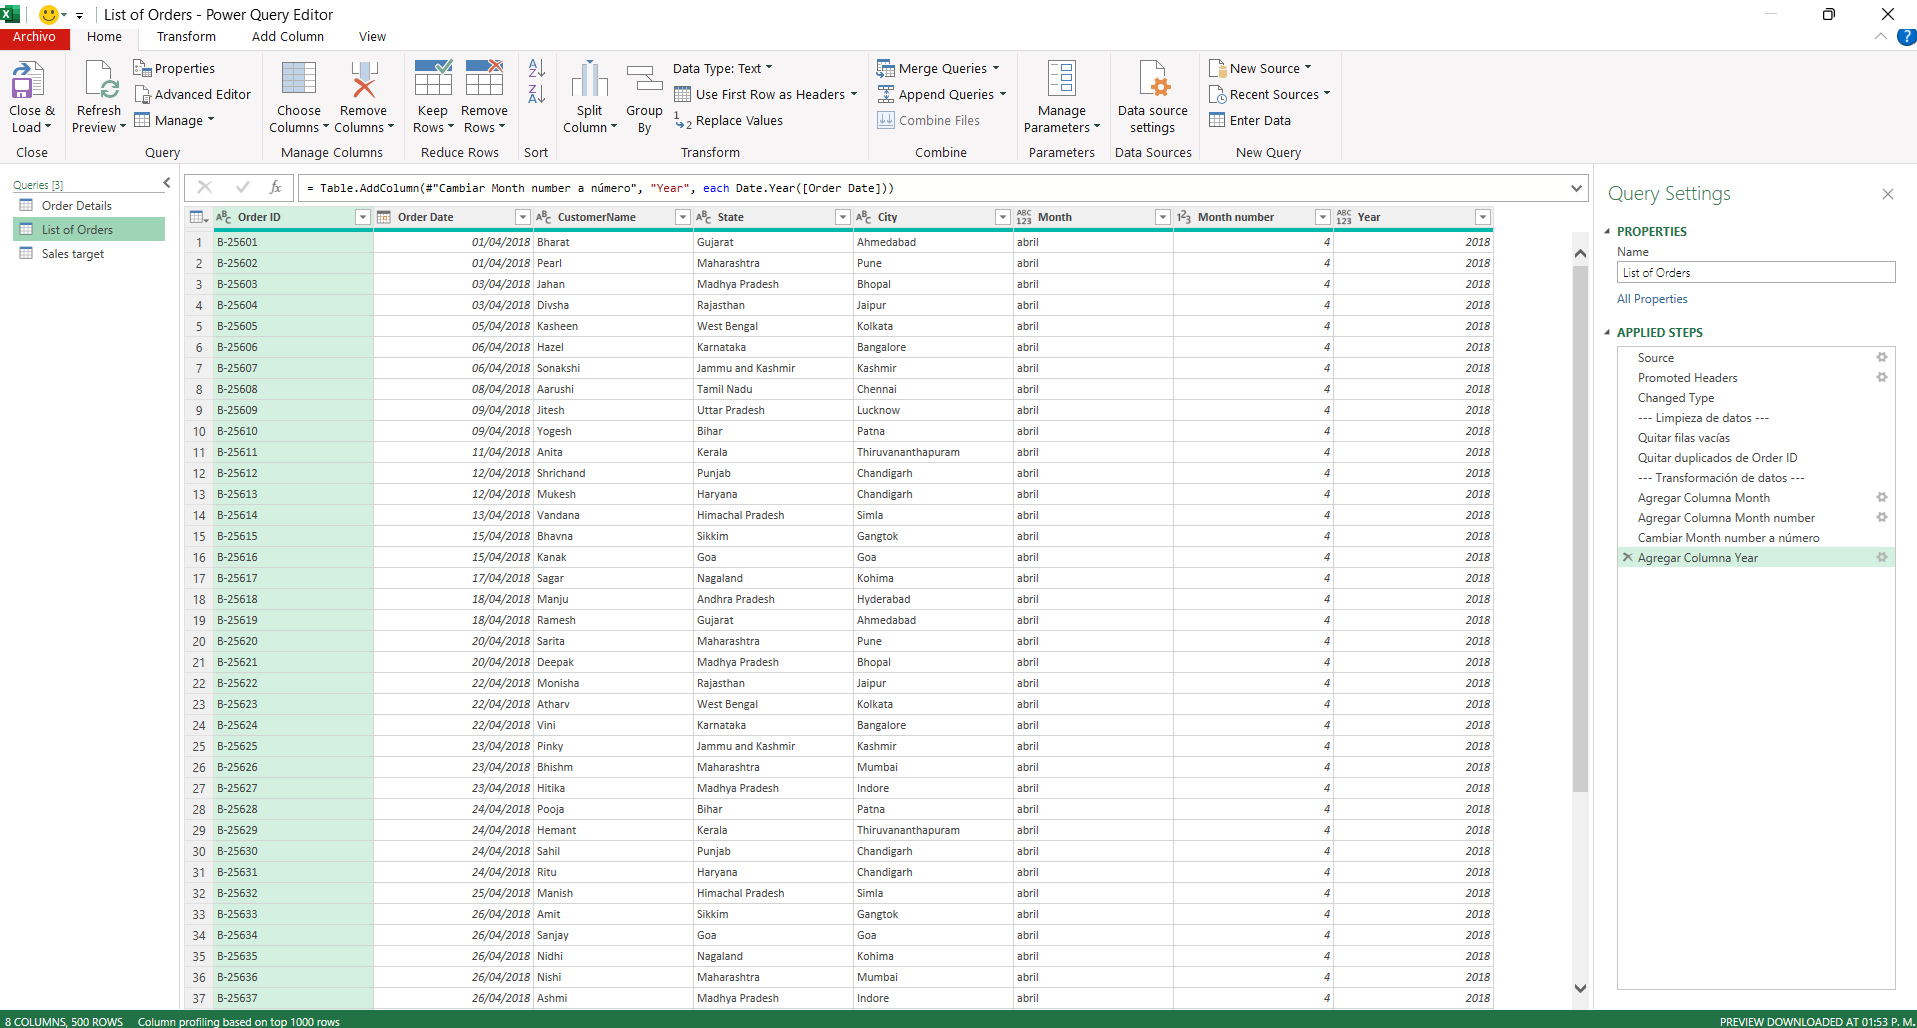
List of Orders Pipeline
- Source: extract data from this GitHub repository
- Promoted Headers: use the first row of the CSV file as headers
- Changed Type: automatically detect the data types for each column
- Remove blank rows
- Remove duplicates from Order ID
- Add Month column from Order Date
- Add Month number column a partir de Order Date
- Cahnge data type of Month number to number
- Add Year column from Order Date
--- Data cleaning ---
--- Data transformation ---
Sales target Pipeline
- Source: extract data from this GitHub repository
- Promoted Headers: use the first row of the CSV file as headers
- Changed Type: automatically detect the data types for each column
- Add Year column from Month of Order Date
- Add Month column from Month of Order Date
- Add Date id column from Year, Month and Category (ID example:
201804Furniture)- A unique ID can be built for each row in this way since there is only one target revenue for each category in each year and each month of that year.
- Change data type of Date id to text
--- Data transformation ---
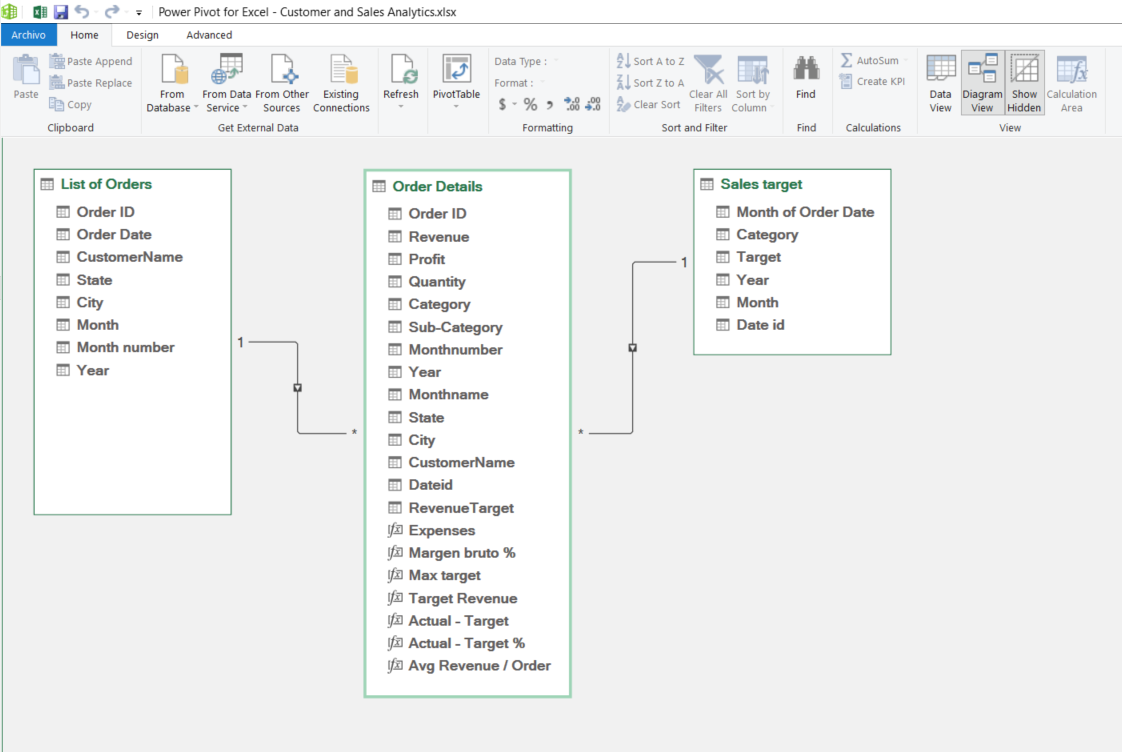
Data model in Power Pivot
In order to join the information from the dataset, the tables were identified as follows:
Tables with primary keys
List of Orders:Order IDSales targetDate id
Table withforeign keys
Order Details:Order ID and Date id, which needs to be built with the information ofList of Orders
First, the connection between Order Details and List of Orders is made and the columns Year and Monthname are created using the DAX expressions:
                =RELATED('List of Orders'[Month])


                =RELATED('List of Orders'[Year])
To then create the column Date id with the following DAX expression:
=CONCATENATE(FORMAT([Year]*100+[Monthnumber],"General Number"),Category])
Next, the connection between Order Details and Target Sales can be made. Thus, the following data model is obtained:
Finally, DAX expressions of the form =RELATED('Tabla'[Columna]) are used to join the tables. The following table is obtained:
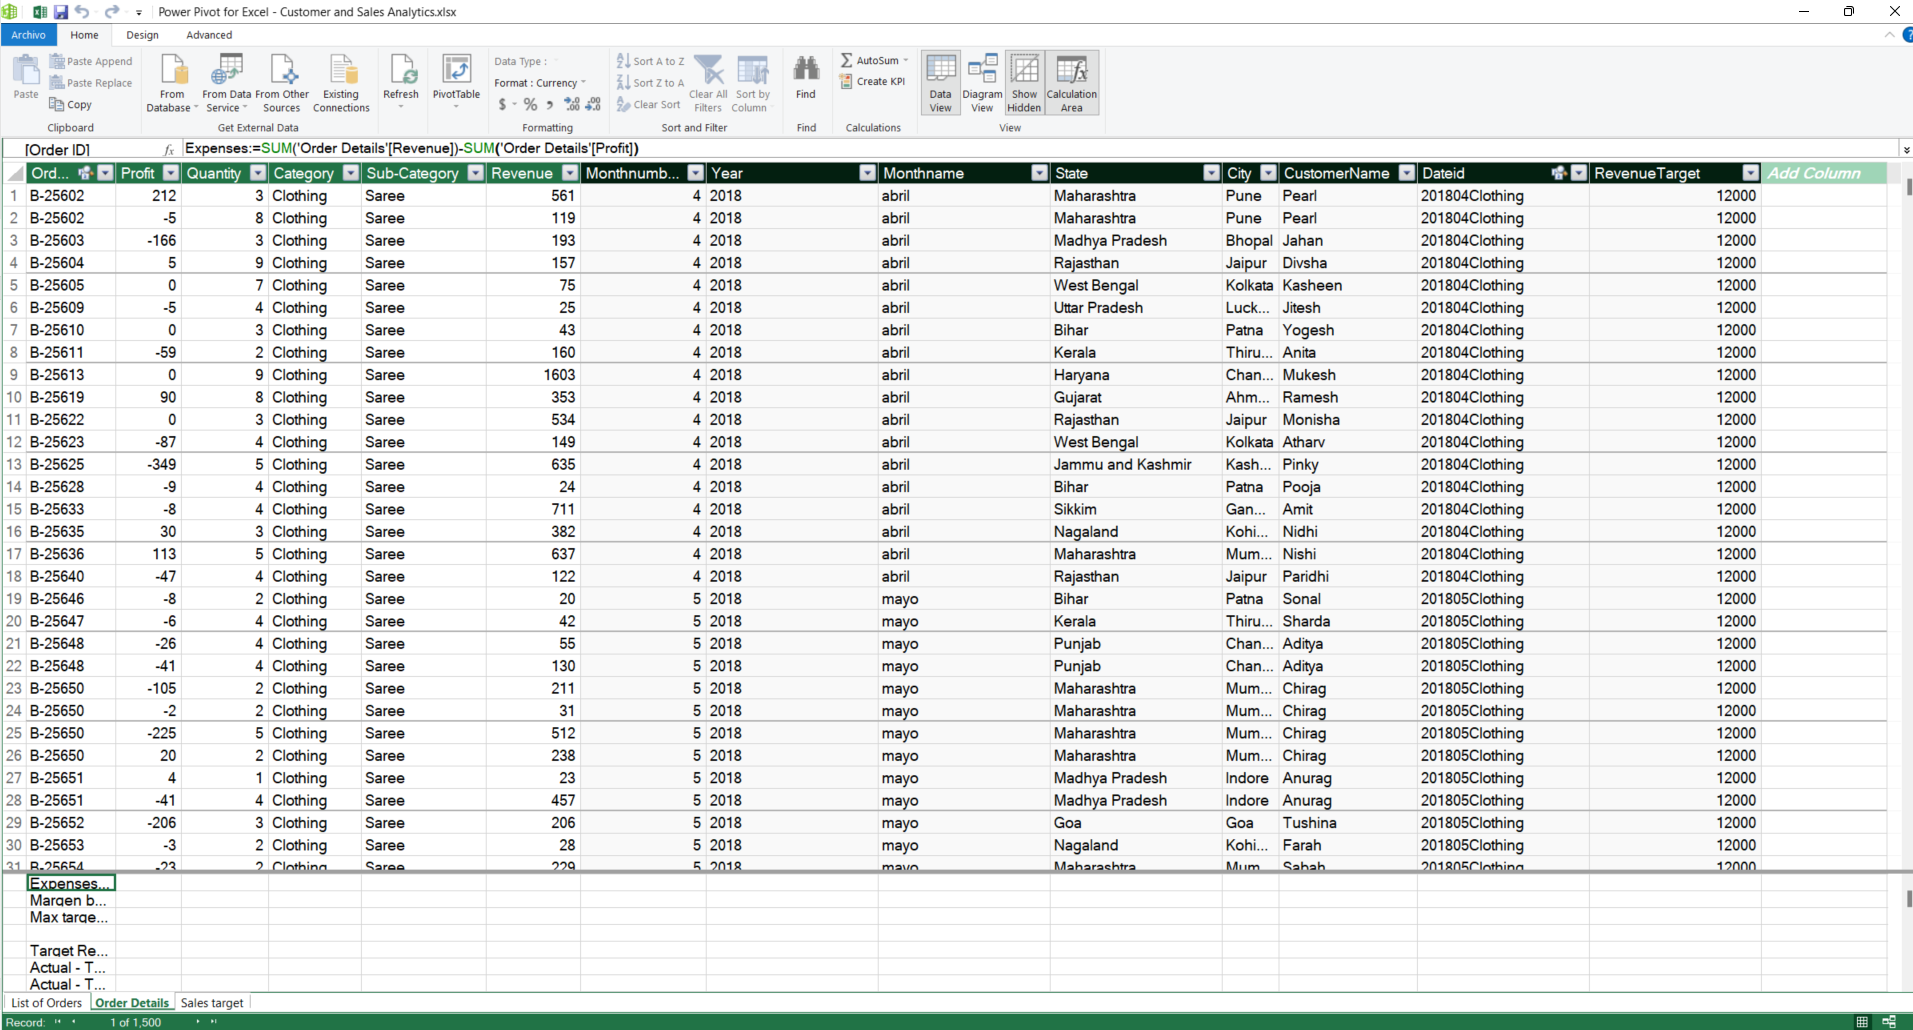
Metrics with Power Pivot
To finish the data processing, the following metrics and auxiliary metrics were created to show the relevant and required information in the reports:
- Expenses: costs calculated using revenue and profit / loss on products. DAX:
=SUM('Order Details'[Revenue])-SUM('Order Details'[Profit]) - Margen bruto %: gross profit margin. Company efficiency in the production and sale of products. DAX
=SUM([Profit])/[Suma de Revenue] - Max target: auxiliary metric to correctly calculate the target revenue in pivot tables. DAX
MAX('Order Details'[RevenueTarget]) - Target Revenue: metric to correctly calculate target revenue in pivot tables. DAX
SUMX(DISTINCT('Order Details'[Dateid]),[Max target]) - Actual - Target: absolute difference between actual revenue and target revenue. DAX
[Suma de Revenue]-[Target Revenue] - Actual - Target %: difference between actual revenue and target revenue relative to target revenue. DAX
[Actual - Target]/[Target Revenue] - Avg Revenue / Order: average revenue per order. DAX
[Suma de Revenue]/[Recuento de Order ID]
Final product
Dataset source
Dataset source: https://www.kaggle.com/datasets/benroshan/ecommerce-data/data?select=Sales+target.csv
Original license of the data: CC0: Public Domain